Autism identification rose from 1 in 150 children to 1 in 31, according to CDC data
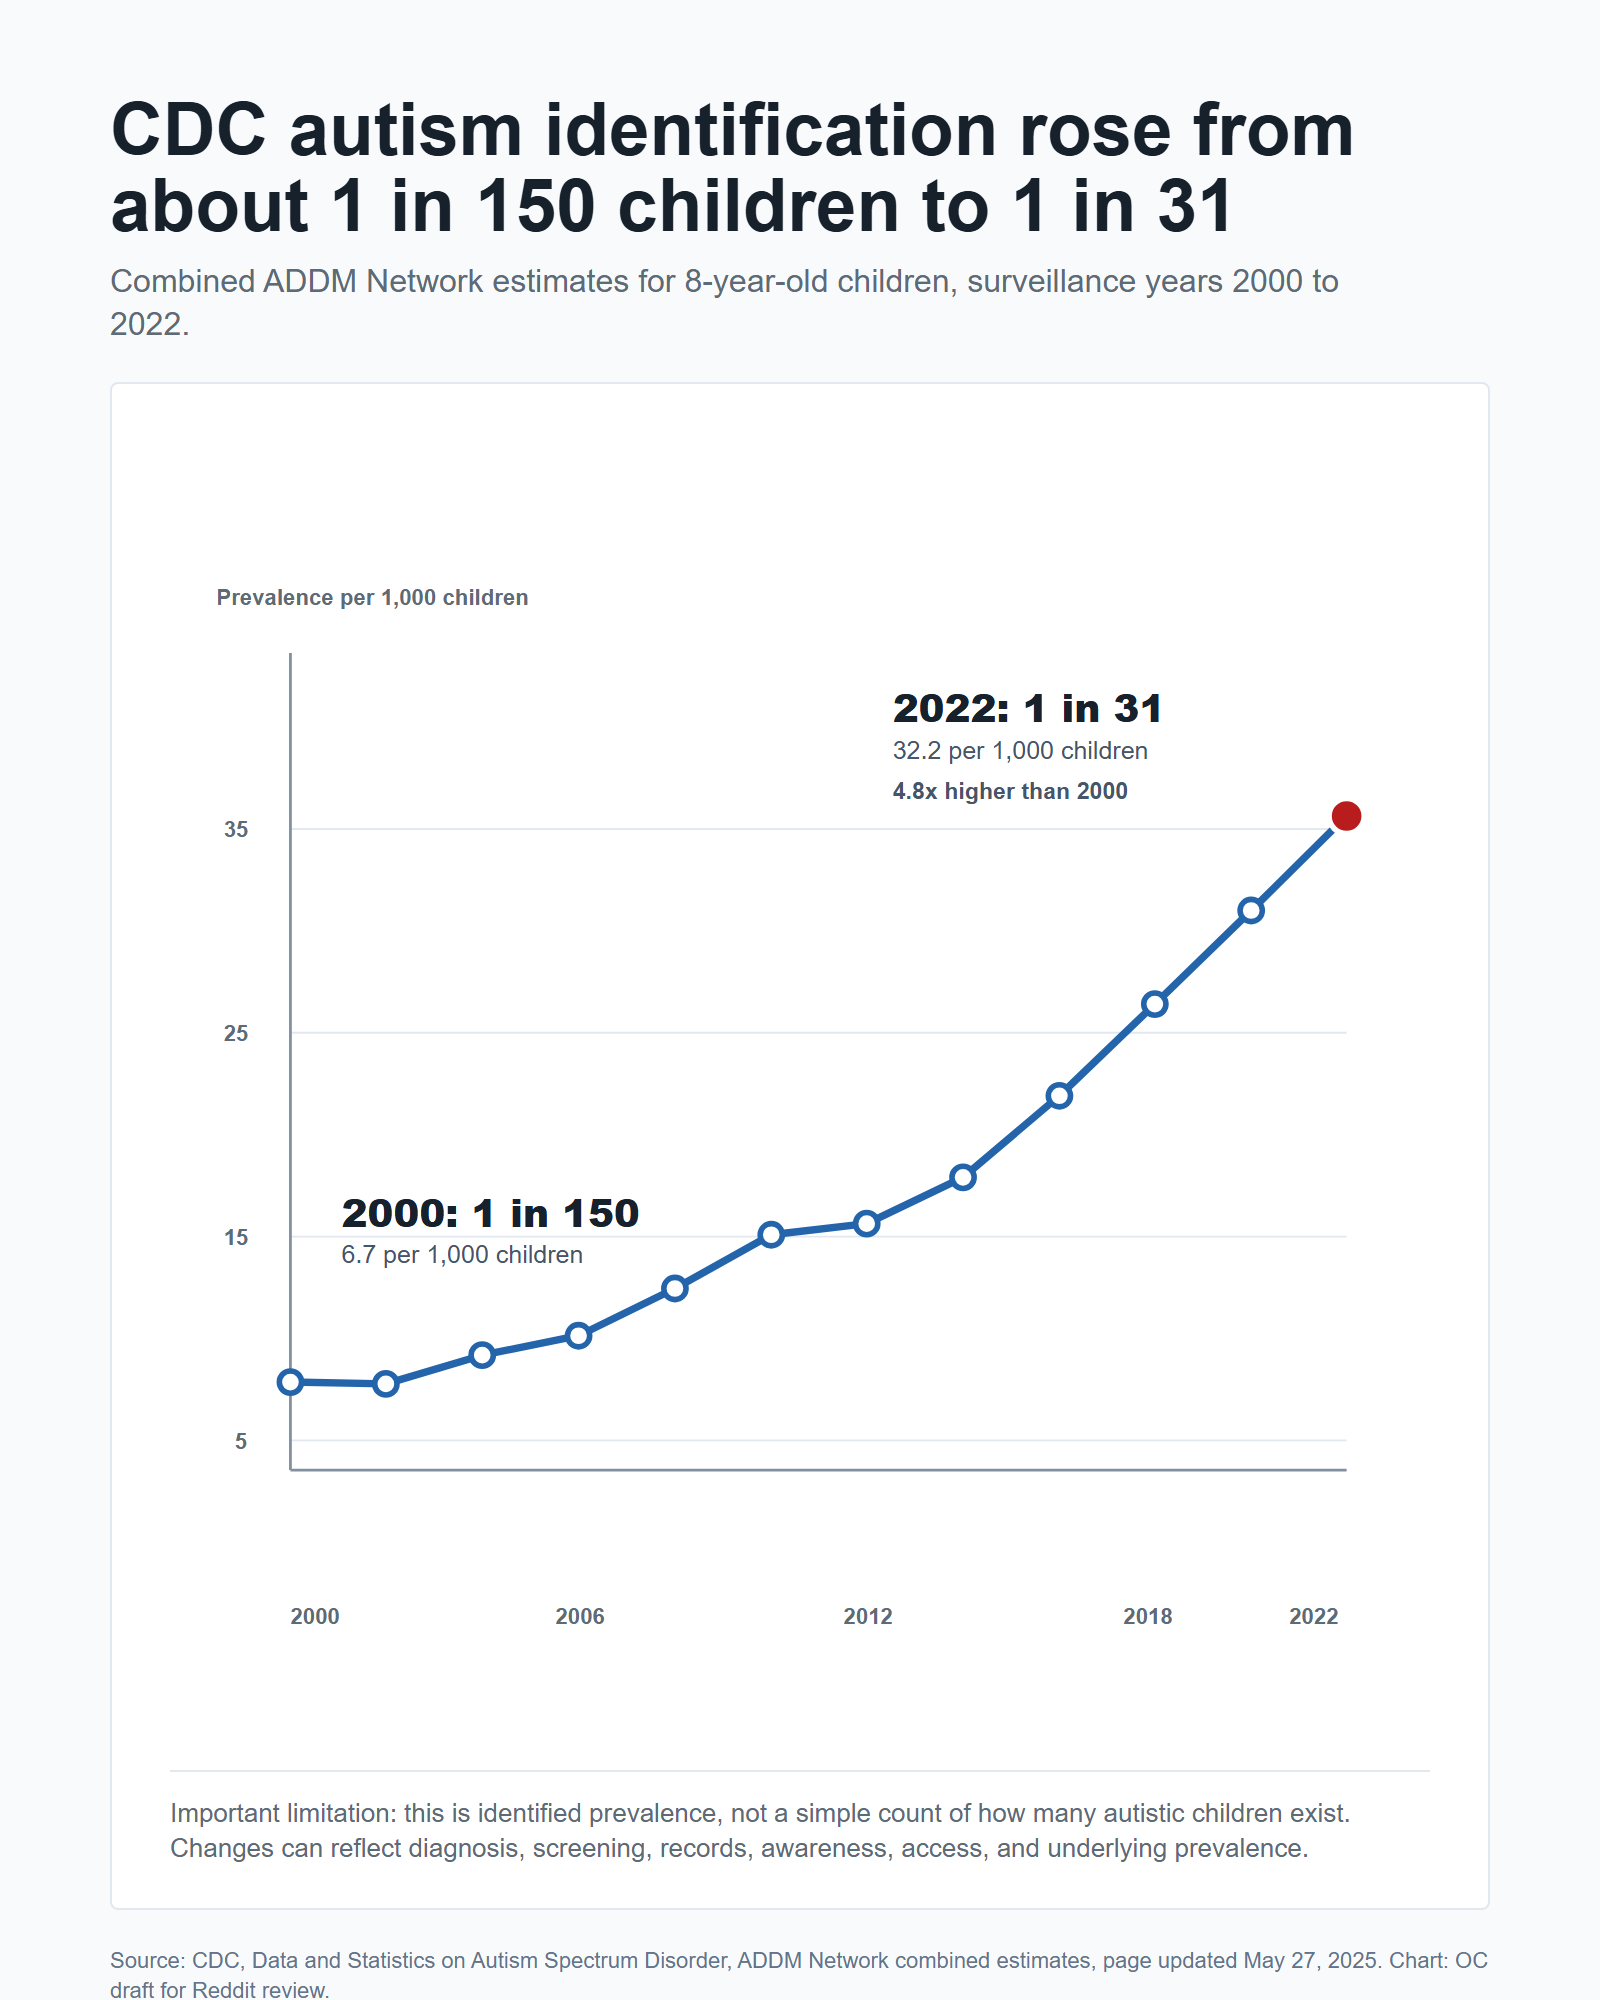
CDC ADDM Network data shows a major rise in identified autism prevalence among 8-year-old children. In the 2000 surveillance year, the combined estimate was about 1 in 150 children. By 2022, it was about 1 in 31.
That does not mean one simple thing caused the change. The CDC measure is identified prevalence, which can be affected by diagnosis, screening, records, awareness, access to evaluation, and underlying prevalence.

The CDC table shows identified autism prevalence among 8-year-old children rose about 4.8x from 2000 to 2022.
What does the CDC chart show?
The chart shows CDC ADDM Network combined estimates for 8-year-old children. The reported identified prevalence moved from 6.7 per 1,000 children in 2000 to 32.2 per 1,000 children in 2022, which is about 4.8 times higher.
Important caveat: This is identified prevalence, not a simple count of how many autistic children exist. Changes can reflect diagnosis, screening, records, awareness, access, and underlying prevalence.
| Surveillance year | Prevalence per 1,000 children | Approximate ratio |
|---|---|---|
| 2000 | 6.7 | 1 in 150 |
| 2002 | 6.6 | 1 in 150 |
| 2004 | 8.0 | 1 in 125 |
| 2006 | 9.0 | 1 in 110 |
| 2008 | 11.3 | 1 in 88 |
| 2010 | 14.7 | 1 in 68 |
| 2012 | 14.5 | 1 in 69 |
| 2014 | 16.8 | 1 in 59 |
| 2016 | 18.5 | 1 in 54 |
| 2018 | 23.0 | 1 in 44 |
| 2020 | 27.6 | 1 in 36 |
| 2022 | 32.2 | 1 in 31 |
What does identified prevalence mean?
Identified prevalence means children identified with autism in the surveillance system, relative to the population being measured. It is not the same as saying the CDC counted every autistic child in the country.
What does this chart not prove?
It does not prove vaccines, parenting, schools, screens, food, or any one cause explains the change. It also does not prove the national trend directly measures Colorado service demand.
Why does this matter for families?
More identified children can mean more families trying to understand evaluations, school services, insurance approval, therapy options, and wait times at the same time.
How Colorado parents should read this: the national trend is useful context, not a local diagnosis or demand forecast. If your child needs support, the practical next step is still local: evaluation records, school conversations, insurance verification, and a therapy plan that fits your home routine.
Methodology and source
This page uses the CDC's Data and Statistics on Autism Spectrum Disorder page, specifically the ADDM Network 2000-2022 combined estimates for 8-year-old children. The 4.8x figure comes from dividing 32.2 per 1,000 in 2022 by 6.7 per 1,000 in 2000.
- Primary source: CDC, Data and Statistics on Autism Spectrum Disorder.
- CDC page update shown during verification: May 27, 2025.
- Measure used: identified prevalence of autism spectrum disorder among 8-year-old children in CDC ADDM Network surveillance years 2000 through 2022.
Trying to understand what this means for your child in Colorado?
Budding Futures ABA works with Colorado families navigating in-home ABA therapy, insurance questions, BCBA-led planning, and parent coaching. This page is a data explainer, not a diagnosis or a claim about any one child.