Which state scored highest?
New York scored highest at 85. It performed strongly across funding, family support, and reported waiting-list access.
New York scored highest in our comparison, but no single number can tell a family where to live. We built a transparent score around four things families can measure: public funding, family support reach, waiting-list access, and provider availability.
The result is a clearer answer than a generic “best states” list, including honest gaps where state reporting cannot be compared.

Use it to ask better questions about support access. Do not use it as a promise about one child's experience.
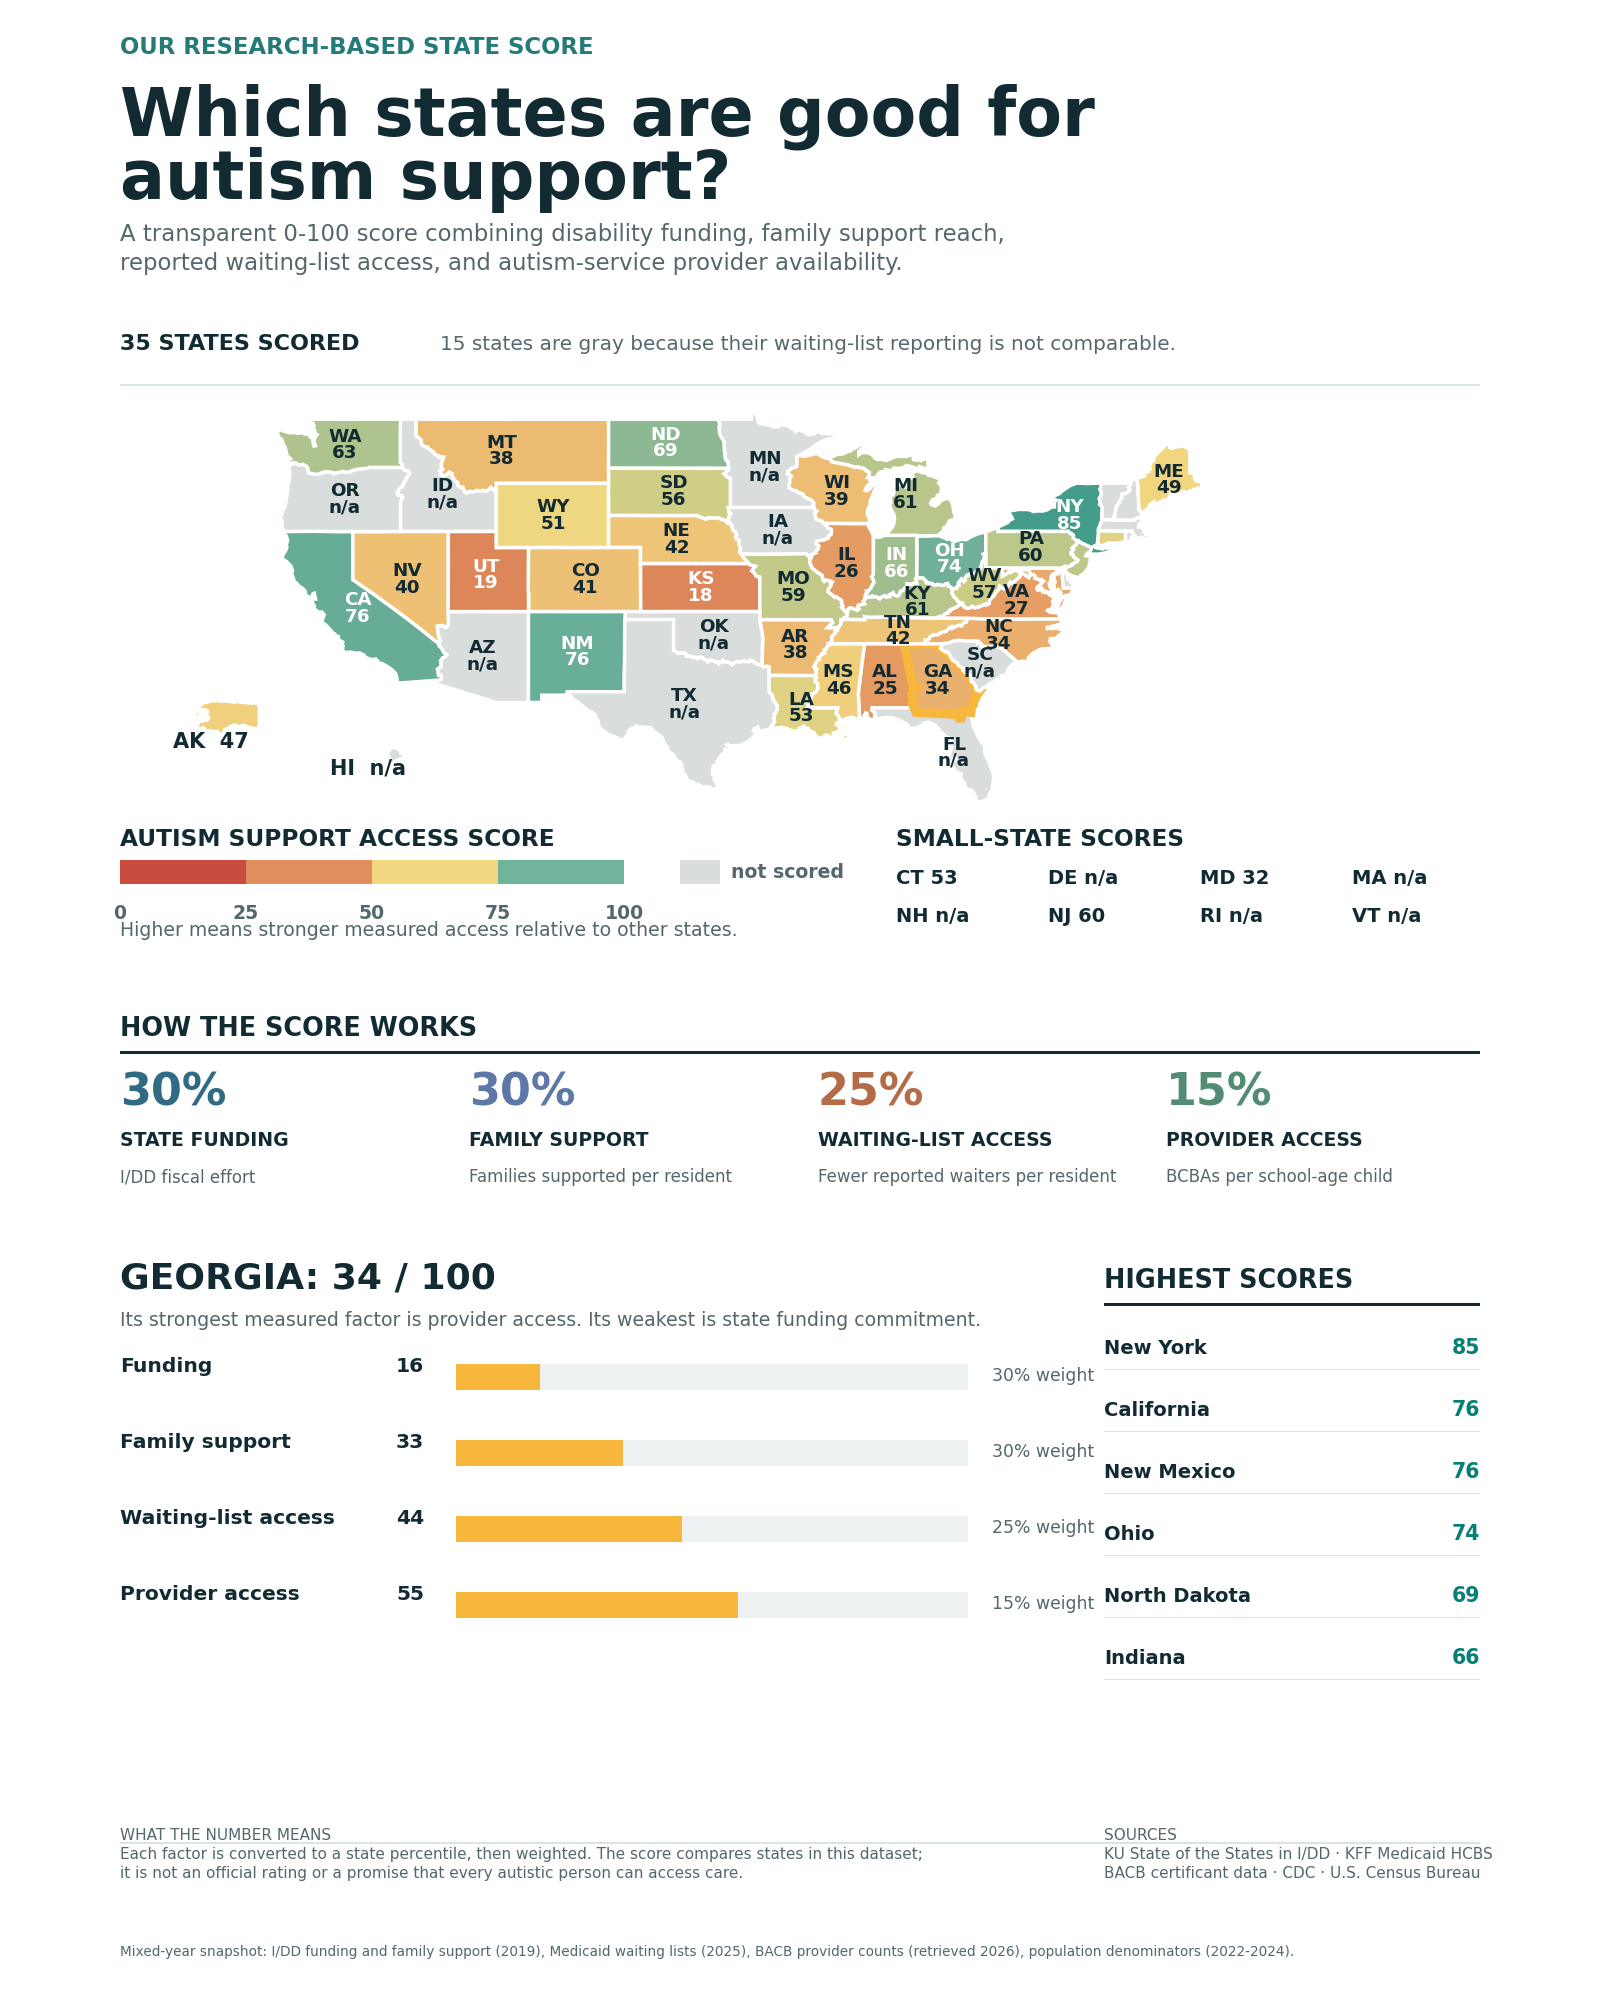
Each factor became a state percentile from 0 to 100, then received the weight shown below. Higher means stronger measured access relative to other states in this study. The formula is our judgment, not an official rating.
Broader I/DD funding commitment.
Families supported per resident.
Fewer reported waiters per resident.
BCBAs per school-age child.
These answers describe the four measures in this study. They do not rate schools, every therapy, community acceptance, cost of living, or the experience of every autistic person.
Alabama had one of the lower measured-access scores in this study, with 25 out of 100. Its strongest factor was waiting-list access; its weakest was funding.
Alaska landed near the middle of the scored states, with 47 out of 100. Its strongest factor was funding; its weakest was provider access.
We did not assign Arizona a final score because its waiting-list reporting was not comparable under the KFF eligibility-screening rule. Among the available factors, family support was strongest and funding was weakest.
Arkansas scored below the middle of the states we could compare, with 38 out of 100. Its strongest factor was funding; its weakest was family support.
Yes, by the measures in this study. California scored 76 out of 100 and ranked among the stronger states. Its strongest factor was family support; its weakest was funding.
Colorado scored below the middle of the states we could compare, with 41 out of 100. Its strongest factor was provider access; its weakest was funding.
Connecticut landed near the middle of the scored states, with 53 out of 100. Its strongest factor was provider access; its weakest was funding.
We did not assign Delaware a final score because its waiting-list reporting was not comparable under the KFF eligibility-screening rule. Among the available factors, provider access was strongest and family support was weakest.
We did not assign Florida a final score because its waiting-list reporting was not comparable under the KFF eligibility-screening rule. Among the available factors, provider access was strongest and funding was weakest.
Georgia scored below the middle of the states we could compare, with 34 out of 100. Its strongest factor was provider access; its weakest was funding.
We did not assign Hawaii a final score because its waiting-list reporting was not comparable under the KFF eligibility-screening rule. Among the available factors, provider access was strongest and funding was weakest.
We did not assign Idaho a final score because its waiting-list reporting was not comparable under the KFF eligibility-screening rule. Among the available factors, funding was strongest and family support was weakest.
Illinois had one of the lower measured-access scores in this study, with 26 out of 100. Its strongest factor was provider access; its weakest was family support.
Indiana scored above most states in this study, with 66 out of 100. Its strongest factor was family support; its weakest was waiting-list access.
We did not assign Iowa a final score because its waiting-list reporting was not comparable under the KFF eligibility-screening rule. Among the available factors, funding was strongest and family support was weakest.
Kansas had one of the lower measured-access scores in this study, with 18 out of 100. Its strongest factor was funding; its weakest was family support.
Kentucky scored above most states in this study, with 61 out of 100. Its strongest factor was family support; its weakest was waiting-list access.
Louisiana landed near the middle of the scored states, with 53 out of 100. Its strongest factor was family support; its weakest was waiting-list access.
Maine landed near the middle of the scored states, with 49 out of 100. Its strongest factor was funding; its weakest was family support.
Maryland scored below the middle of the states we could compare, with 32 out of 100. Its strongest factor was provider access; its weakest was waiting-list access.
We did not assign Massachusetts a final score because its waiting-list reporting was not comparable under the KFF eligibility-screening rule. Among the available factors, provider access was strongest and family support was weakest.
Michigan scored above most states in this study, with 61 out of 100. Its strongest factor was waiting-list access; its weakest was funding.
We did not assign Minnesota a final score because its waiting-list reporting was not comparable under the KFF eligibility-screening rule. Among the available factors, funding was strongest and provider access was weakest.
Mississippi landed near the middle of the scored states, with 46 out of 100. Its strongest factor was family support; its weakest was provider access.
Missouri landed near the middle of the scored states, with 59 out of 100. Its strongest factor was waiting-list access; its weakest was provider access.
Montana scored below the middle of the states we could compare, with 38 out of 100. Its strongest factor was family support; its weakest was provider access.
Nebraska scored below the middle of the states we could compare, with 42 out of 100. Its strongest factor was waiting-list access; its weakest was family support.
Nevada scored below the middle of the states we could compare, with 40 out of 100. Its strongest factor was waiting-list access; its weakest was funding.
We did not assign New Hampshire a final score because its waiting-list reporting was not comparable under the KFF eligibility-screening rule. Among the available factors, provider access was strongest and funding was weakest.
New Jersey landed near the middle of the scored states, with 60 out of 100. Its strongest factor was waiting-list access; its weakest was family support.
Yes, by the measures in this study. New Mexico scored 76 out of 100 and ranked among the stronger states. Its strongest factor was waiting-list access; its weakest was provider access.
Yes, by the measures in this study. New York scored 85 out of 100 and ranked among the stronger states. Its strongest factor was funding; its weakest was provider access.
North Carolina scored below the middle of the states we could compare, with 34 out of 100. Its strongest factor was provider access; its weakest was waiting-list access.
North Dakota scored above most states in this study, with 69 out of 100. Its strongest factor was funding; its weakest was provider access.
Yes, by the measures in this study. Ohio scored 74 out of 100 and ranked among the stronger states. Its strongest factor was waiting-list access; its weakest was provider access.
We did not assign Oklahoma a final score because its waiting-list reporting was not comparable under the KFF eligibility-screening rule. Among the available factors, family support was strongest and provider access was weakest.
We did not assign Oregon a final score because its waiting-list reporting was not comparable under the KFF eligibility-screening rule. Among the available factors, funding was strongest and provider access was weakest.
Pennsylvania scored above most states in this study, with 60 out of 100. Its strongest factor was funding; its weakest was waiting-list access.
We did not assign Rhode Island a final score because its waiting-list reporting was not comparable under the KFF eligibility-screening rule. Among the available factors, provider access was strongest and family support was weakest.
We did not assign South Carolina a final score because its waiting-list reporting was not comparable under the KFF eligibility-screening rule. Among the available factors, family support was strongest and funding was weakest.
South Dakota landed near the middle of the scored states, with 56 out of 100. Its strongest factor was waiting-list access; its weakest was provider access.
Tennessee scored below the middle of the states we could compare, with 42 out of 100. Its strongest factor was waiting-list access; its weakest was funding.
We did not assign Texas a final score because its waiting-list reporting was not comparable under the KFF eligibility-screening rule. Among the available factors, provider access was strongest and funding was weakest.
Utah had one of the lower measured-access scores in this study, with 19 out of 100. Its strongest factor was provider access; its weakest was waiting-list access.
We did not assign Vermont a final score because its waiting-list reporting was not comparable under the KFF eligibility-screening rule. Among the available factors, family support was strongest and funding was weakest.
Virginia had one of the lower measured-access scores in this study, with 27 out of 100. Its strongest factor was provider access; its weakest was waiting-list access.
Washington scored above most states in this study, with 63 out of 100. Its strongest factor was waiting-list access; its weakest was funding.
West Virginia landed near the middle of the scored states, with 57 out of 100. Its strongest factor was funding; its weakest was provider access.
Wisconsin scored below the middle of the states we could compare, with 39 out of 100. Its strongest factor was funding; its weakest was family support.
Wyoming landed near the middle of the scored states, with 51 out of 100. Its strongest factor was family support; its weakest was provider access.
New York scored highest at 85. It performed strongly across funding, family support, and reported waiting-list access.
Their waiting-list reporting was not comparable under KFF's eligibility-screening distinction. We chose not to treat missing or different reporting as a poor score.
No. School quality and special education experiences vary within each state and were not part of this score.
No. The waiting-list measure covers broader intellectual and developmental disability programs that include some autistic people.
No. Use the score as a starting point, then check the exact programs, providers, schools, eligibility rules, and costs that affect your family.
Colorado scored 41. Provider availability was a strength, while the broader state-funding measure was weaker. Budding Futures can help Colorado families explore ABA therapy across Colorado and Medicaid ABA therapy.
The data years differ because no single current national source covers every factor. Funding and family-support data are from 2019, waiting-list data are from 2025, provider counts were retrieved in 2026, and population denominators are from 2022 to 2024.
The weights are subjective. Broader I/DD measures include some autistic people but are not autism-only. BCBA counts do not show appointment availability, insurance acceptance, or quality. A high score does not guarantee access for one person.
See the full set on our autism and ABA research page, or read one of these next.
The CDC ADDM autism prevalence trend from 2000 through 2022.
Autism rose from 1 in 18 Colorado special education students in 2012 to 1 in 9 by 2024.
What parent and provider discussions reveal about billing, supervision, hours, and safety.
Budding Futures ABA works with Colorado families who need clear answers about in-home ABA and Medicaid coverage.